
Syria’s foreign trade statistics show a sharp post-2011 collapse: exports fell from about US$11.3 billion in 2010 to roughly US$1 billion in 2021, with partial recovery to an estimated US$2 billion in 2025. Imports also shrank from US$17.5 billion in 2010 to about US$5 billion. The EU, China, Lebanon and Turkey are among its main partners.
Syria’s foreign trade at a glance
Syria’s recorded merchandise trade rests on two layers of data. Official figures begin with customs declarations, compiled by the Central Bureau of Statistics (Syria), المكتب المركزي للإحصاء في سوريا. They cover the areas where the government collected records in a given year. International datasets standardise those submissions into US dollars and add partner-country reports. The clearest annual reference points are 2010, the last year before the 2011 conflict, and 2021. A 2025 estimate indicates partial export recovery, but reporting remains uneven.
Latest available data
As of 2025, the most recent EU figures come from Eurostat. Global aggregates from UN Comtrade and ITC Trade Map continue to be revised as countries submit corrections. Many annual values between 2012 and 2020 are discontinuous and should be treated as lower-bound estimates.
Exports, imports and trade balance, 2010–2025
The table shows the annual series available from the sources consulted. Values are expressed in current US dollars and rounded to one decimal place. Years marked as estimates draw mainly on partner-country mirror records rather than on Syrian customs declarations.
| Year | Exports (US$ billion) | Imports (US$ billion) | Trade balance (US$ billion) | Source / note |
|---|---|---|---|---|
| 2010 | 11.3 | 17.5 | −6.2 | UN Comtrade / ITC Trade Map |
| 2011 | 8.5 | 16.0 | −7.5 | UN Comtrade / ITC Trade Map; final pre-conflict year |
| 2012 | 4.0 | 10.5 | −6.5 | UN Comtrade / ITC Trade Map; reporting becomes partial |
| 2013 | 2.5 | 8.0 | −5.5 | UN Comtrade / ITC Trade Map; mirror records gain weight |
| 2014 | 2.0 | 7.5 | −5.5 | UN Comtrade / ITC Trade Map |
| 2015 | 1.8 | 6.5 | −4.7 | UN Comtrade / ITC Trade Map |
| 2016 | 1.5 | 5.8 | −4.3 | UN Comtrade / ITC Trade Map |
| 2017 | 1.4 | 5.5 | −4.1 | UN Comtrade / ITC Trade Map |
| 2018 | 1.3 | 5.2 | −3.9 | UN Comtrade / ITC Trade Map |
| 2019 | 1.2 | 5.0 | −3.8 | UN Comtrade / ITC Trade Map |
| 2020 | 1.1 | 4.8 | −3.7 | UN Comtrade / ITC Trade Map |
| 2021 | 1.0 | 5.0 | −4.0 | UN Comtrade / ITC Trade Map; latest full annual |
| 2022 | est. 1.2 | est. 5.5 | est. −4.3 | UN / ITC estimate; confirmation pending |
| 2023 | est. 1.5 | est. 6.0 | est. −4.5 | UN / ITC estimate |
| 2024 | est. 1.8 | est. 6.2 | est. −4.4 | UN / ITC estimate |
| 2025 | est. 2.0 | est. 6.5 | est. −4.5 | UN / ITC estimate |
In 2010 Syria exported about US$11.3 billion and imported US$17.5 billion, giving a trade deficit of US$6.2 billion. By 2021 exports had fallen by roughly nine-tenths to about US$1 billion, while imports dropped by about seven-tenths to about US$5 billion. The 2025 export estimate of about US$2 billion marks a partial recovery, but remains far below the 2010 level. The persistent gap after 2011 reflects both the collapse in export capacity and continued dependence on imported food, fuel and machinery.
Figures for Syria are less precise than for many other countries because official reporting has been incomplete since 2011. Between 2012 and 2020, annual series are discontinuous in Syrian official records. The UN and ITC fill gaps mainly from partner-country returns, which may differ from Syrian declarations. For that reason values after 2011 are best read as ranges rather than exact totals. A 2025 figure should be treated as provisional until the underlying customs and mirror records are confirmed.
What Syria exports and imports
ITC Trade Map classifies Syria’s recorded trade into broad product groups. On the export side, the groups most commonly reported are crude oil and petroleum products, phosphates and related chemicals, food products such as olive oil, fruit, vegetables, cumin and lentils, textiles and basic manufactures. Imports are more varied: refined fuels, cereals and processed foods, pharmaceuticals, machinery and electrical equipment, and vehicles and parts all appear in the data.
The mix is not stable from year to year. Crude oil and phosphate exports depend on security around production and transport routes, while food and textile exports respond to agricultural seasons and regional demand. Import priorities shift with the exchange rate and with availability of foreign currency.
Because Syrian official data are incomplete after 2011, the product groups are best read as relative indicators rather than exact shares. The same caveat applies to the EU product list: Eurostat records EU imports from Syria by product section, but the composition differs from the global totals reported by the UN.
Syria’s main trade partners
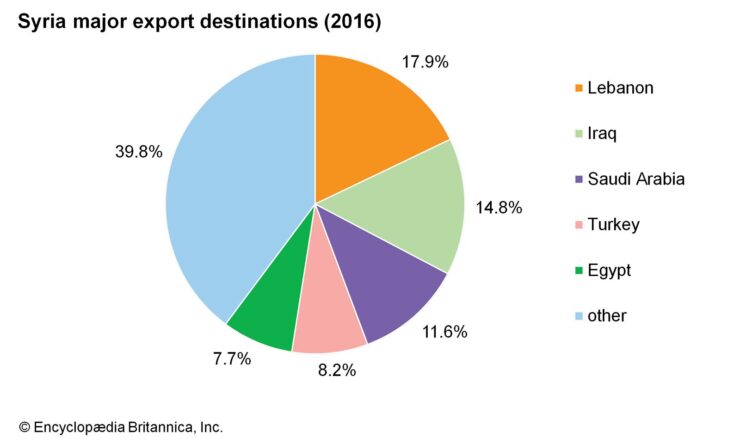
The partner mix shifts by year, but several names recur in the available datasets. According to Eurostat, total EU-Syria trade in goods reached €193 million in 2025, with EU imports from Syria at €150 million. Those Eurostat values cover the European Union as a bloc and are expressed in current euros, so they are not directly comparable with the US dollar totals in the annual table. UN Comtrade and ITC Trade Map partner rankings also point to China, Lebanon, Turkey, Iraq and Egypt as frequent counterparties in Syria’s recorded trade.
The partner table summarises the most recent available indications, with the EU as the only partner for which the sources consulted provide an explicit 2025 figure.
| Partner | Latest reported indication | Reported year |
|---|---|---|
| European Union | Total trade with Syria €193 million; EU imports from Syria €150 million (Eurostat) | 2025 |
| China | Recurrent top partner in Syria’s total trade records | Latest reported year, variable |
| Turkey | Recurrent top partner, especially in import flows | Latest reported year, variable |
| Lebanon | Main regional transit and trade partner | Latest reported year, variable |
| Iraq | Regular partner in Syrian export and import records | Latest reported year, variable |
| Egypt | Regular partner in Syrian trade records | Latest reported year, variable |
Lebanon is particularly important as a transit route for goods that enter or leave Syria through the Mediterranean, while Turkey and Iraq account for substantial land-border trade. China appears mainly as a supplier of manufactured goods, and Egypt as a regional market for Syrian agricultural and industrial exports. The EU’s Generalised Scheme of Preferences (GSP) grants reduced duties on certain Syrian products, but its utilisation rate varies by product section and by year.
How to read Syria’s trade figures
Syrian official trade returns cover only the areas where the government could collect customs declarations. For the rest of the country, UN Comtrade and ITC Trade Map combine data reported by partner countries, which is why 2010 values are firmer than later ones. The UN converts trade values to US dollars using official exchange rates or partner-market rates, so small differences between datasets are normal.
World Bank WITS pulls together many of the same series and adds macro indicators, making it useful for comparisons with GDP. Before using a figure, check the year, the coverage note and the source. More detail on the statistical office behind Syria’s official records appears in an explainer on what the Central Bureau of Statistics covers.
Background: why the numbers shifted after 2010
Between 2010 and 2021 Syria’s recorded exports fell by roughly nine-tenths and imports by about seven-tenths. The contraction came with conflict, international sanctions and reduced activity at the ports of Latakia and Tartous. A weaker Syrian pound, examined in Syria’s currency crisis, and falling labour productivity reinforced the decline.
Frequently asked questions
What is Syria’s trade balance?
Syria has run a persistent trade deficit since 2011. Imports exceeded exports in every year for which comparable figures are available, although both flows collapsed after 2010.
What does Syria mainly export?
Crude oil, phosphates, food products, textiles and some manufactured goods. The exact mix varies by year and by the source that reports the data.
Who are Syria’s main trading partners?
The EU, China, Lebanon, Turkey, Iraq and Egypt appear most often in the available datasets, although rankings vary by year.
Where can I find Syria foreign trade statistics?
UN Comtrade, ITC Trade Map, Eurostat and World Bank WITS publish the underlying annual figures, including the 2010–2025 reference points.
Sources
UN Comtrade ITC Trade Map Eurostat World Bank WITS

Published by